A18 Pro … your thoughts?

Interesting … then there’s an inconsistency with the results @Jimmyjames posted from Tom's Guide showing the A18 Pro losing to the A750 GPU on Steel Nomad Light.

Edit: This isn’t them cooling it with liquid nitrogen is it?

EDIT2: Doesn't appear to be. And the 8 gen 3 scores are pretty much the same. Huh. They also have the A17Pro beating the 8 gen 3 in Steel Nomad Light too.

EDIT 3:


Tom's S24 Ultra result is a little higher than the S24+ result above but not out of the range of other 8 gen 3 results:


Xiaomi 14Pro result which should be the same as in the video:


which is a little lower than the S24+/Ultra results from UL/Tom's.

No data on UL's website for the iPhone 16 (Pro) yet, but this is more in agreement with Tom's than Geekerwan whose results show the iPhone 15 pro beating the Xiaomi 14 Pro. The A18 Pro should be about 10-15% faster than the iPhone 15 Pro above. Tom's has it about 12% faster which makes sense and would indeed place it behind the 8 gen 3 and Dimensity 9300+ - again those latter scores Geekerwan agrees with. I'd say it looks likely that Geekerwan screwed something up here but only with their iPhones somehow ... not sure.

Now I'm curious how Geekerwan gets the GPU to adopt three different performance points ... there's only low power mode right?

EDIT 4: Geekerwan's FPS line up with Tom's Guide/UL though - For the A18 Pro Tom's got ~11.6, Geekerwan got 11.63. And for the A17 Pro Geekerwan say 9.47 FPS while UL says 9-10 FPS. So why are the scores so different?
This is my Steel Nomad Light result from my 15 Pro Max for comparison.
1726767193446.png
 
The real questions are how smooth and fast everything runs. Does it run our games and apps fast and smooth? Does Apple AI run fast and smooth? What is the battery life? Does it stay cool?
 
This is my Steel Nomad Light result from my 15 Pro Max for comparison.
View attachment 31430
While those numbers are a good deal higher for the iPhone 15 Pro than what we saw from UL and what is expected based on the 16 Pro Max from Tom's, they are at least concordant with how pairs of scores should look like. An overall score of 1703 should correspond to an FPS just over 12.6. Geekerwan is claiming the A17Pro got over 1750 but only an FPS of 9.47. Similarly they claim the A18Pro gets a score over 2000 with again a lower FPS than yours of only 11.63. This indicates two things:

1) Steel Nomad has a high run-to-run variance within and between devices even with the same processor.

2) Geekerwan's iPhone numbers make no sense. Their stated FPS and scores are completely discordant. One of them, the FPS or the score, has to be wrong. Weirdly their Android scores seem to be okay ... I don't know what to make of that.

The real questions are how smooth and fast everything runs. Does it run our games and apps fast and smooth? Does Apple AI run fast and smooth? What is the battery life? Does it stay cool?
The Geekerwan review @Jimmyjames posted answers those questions. Although I don't think Apple Intelligence can obviously be tested until its release (I mean betas I know, but generally reviewers don't test beta features).

It seems, at least according to Geekerwan, that Apple’s claim about 2x ray tracing performance are correct.

View attachment 31420

What's interesting about this is that their test confirms the almost double ray tracing potential of the A18Pro over the A17Pro, but less of an increase for the M4 over M3 (though there is still a big increase of 37%) and yet the Solar Bay scores for each, the A18 Pro and M4, both increased by 22% over their respective previous chips, the A17 Pro and M3. So it's weird right? It still seems like new RT cores in the M4 are maybe the same ones in the A18Pro but in this one test they don't give quite the same uplift maybe because the test itself isn't able to saturate the M3/M4 with rays the same way? Hmmm ... possible. Could the RT cores be more of a bottleneck in the A17Pro than the M3? Maybe? If for the Geekerwan benchmark the numbers of rays are the same, simply having more RT cores to process the rays on the M3 may mean that making those cores 2x as fast on the same test in the M4 doesn't correspond to the same uplift. They can't get any more work done faster because they're already completing their job faster than the rest of the processor can feed them new rays. The same is not true on the A17Pro and A18Pro so the increase looks better. I could buy that.
 
Last edited:
With inspiration from @dada_dave and @leman’s posts here:

...and with the aim of learning more about python, I have made a plot (with significant influence from @leman’s own work) comparing the iPhone 15 Pro/Max (A17 Pro) with the iPhone 16 (A18). It was a fun exercise and as someone pretty new to this stuff, challenging at times. I’m not sure it provides any insights we didn’t already have, but now I have what I need to make these rapidly, including scraping Geekbench’s site for the json. Feedback welcome.

1727114448827.png
 
...and with the aim of learning more about python, I have made a plot (with significant influence from @leman’s own work) comparing the iPhone 15 Pro/Max (A17 Pro) with the iPhone 16 (A18). It was a fun exercise and as someone pretty new to this stuff, challenging at times. I’m not sure it provides any insights we didn’t already have, but now I have what I need to make these rapidly, including scraping Geekbench’s site for the json. Feedback welcome.
Well that's quite interesting. If it touches storage, I can easily understand the Compression test showing no change. But what about horizon detection? Anyone have any idea why that would show such a regression?

(This is not me whining, many changes have winners & losers, and if the former dominate, then that's still a good thing. I'm just curious.)
As expected, a similar result for horizon detection occurred when comparing the M4 to M3 (although comparing with @leman's charts there is at least one differences, clang looks much better improved in A18 Pro vs A17 Pro than M4 to M3). If I had to guess some of this is down to clockspeed. The M4 is a big clock boost relative to the M3 - as is the A18 Pro vs A17 Pro. If none of the microarchitectural/SOC changes help a particular workload enough, maybe the increase in clocks results in a slight decrease in iso-clock performance (i.e. the CPU is spending more of its time doing hurry up and wait).
 
As expected, a similar result for horizon detection occurred when comparing the M4 to M3 (although comparing with @leman's charts there is at least one differences, clang looks much better improved in A18 Pro vs A17 Pro than M4 to M3). If I had to guess some of this is down to clockspeed. The M4 is a big clock boost relative to the M3 - as is the A18 Pro vs A17 Pro. If none of the microarchitectural/SOC changes help a particular workload enough, maybe the increase in clocks results in a slight decrease in iso-clock performance (i.e. the CPU is spending more of its time doing hurry up and wait).
Interesting. I'd forgotten about the M3->M4 similarity. My first (not especially educated) guess was that some microarchitectural change needed to hit higher clocks caused a few small regressions... which might actually come to the same thing as what you said, though not necessarily.
 
I have made a plot (with significant influence from @leman’s own work) comparing the iPhone 15 Pro/Max (A17 Pro) with the iPhone 16 (A18). It was a fun exercise and as someone pretty new to this stuff, challenging at times. I’m not sure it provides any insights we didn’t already have, but now I have what I need to make these rapidly, including scraping Geekbench’s site for the json. Feedback welcome.

Very nice! I am surprised to see an ISO-clock improvement in Clang, it has been stagnant since M1. I thought this was a particularly hard threshold to crack.

How many results do you have in your sample?

If it touches storage, I can easily understand the Compression test showing no change.

Nothing in GB should touch storage. It is not a perfect benchmark, but its authors are competent. No difference would mean that the algorithm does not benefit from micro-architectural improvements found in the new CPUs. It could be cache-bandwidth limited for example. Remember: this is ISO-clock (normalized) ratio, the newer CPUs are still faster.

But what about horizon detection? Anyone have any idea why that would show such a regression?

Impossible to say without a meticulous, likely time-consuming analysis that would require detailed profiling of the code. Could be anything from differences in cache sizes and latencies to effects from higher frequency, as @data_dave suggested.
 
Very nice! I am surprised to see an ISO-clock improvement in Clang, it has been stagnant since M1. I thought this was a particularly hard threshold to crack.

How many results do you have in your sample?
100 from iPhone 15 Pro/Max and 100 from iPhone 16. I can get more, although the Geekbench search is pretty unreliable.

The other possibility is that I am wrong, and made a mistake somewhere! I wouldn’t be surprised. I will check it again.
 
100 from iPhone 15 Pro/Max and 100 from iPhone 16. I can get more, although the Geekbench search is pretty unreliable.

The other possibility is that I am wrong, and made a mistake somewhere! I wouldn’t be surprised. I will check it again.
I think that’s more than we grabbed for the M-series plots. While a stats test would be needed to make sure mathematically, even visually they look distinct enough to say that they are different. My default would be to again hypothesize “clocks!” but as @leman said one would need very careful analysis to “know” vs just “suppose”.
 
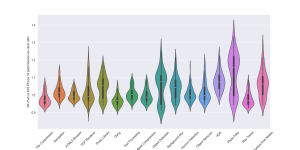
@leman @dada_dave So I checked the Clang scores manually and it checks out afaik. I also ran it for the same two devices you used: M4 iPad vs M3 MacBook Air and my scores look similar to you for Clang at least.
I removed the top and bottom 5% whereas you removed top and bottom 1%. I don’t think that would make a difference, but I can run it again at 1% if it helps.
1727200890957.png
 
I removed the top and bottom 5% whereas you removed top and bottom 1%.
I wonder if there is a practical way to calculate the mean by calculating the median and then weighting the components against the overall range so that the contribution of each value is biased against its distance from the median and whether that would provide a more useful result.
 
I wonder if there is a practical way to calculate the mean by calculating the median and then weighting the components against the overall range so that the contribution of each value is biased against its distance from the median and whether that would provide a more useful result.
I wonder if discarding top results is actually a good idea if you're trying to understand a chip's possibilities (and its (micro)architecture), as opposed to likely real-world performance. That is, aside from corrupted data (either accidental or on purpose, which is apparently a significant problem, at least for x86 chips), if you want to understand what a chip is capable of, perhaps the highest scores are more interesting than the average. Presumably due to uncontrolled conditions during runs, where scores are usually diminished by external factors (other processes taking away resources), scores will usually represent less than a chip's full capabilities.

For the purpose of this discussion, I'd classify extreme cooling as "corrupted data", for any chip that has a user-adjustable clock. You could make an argument that that wouldn't apply to (for example) the M4 iPP score because it just keeps the chip from dropping to a lower speed, rather than allowing you to boost it to a higher speed. That would of course enrage x86 partisans. :-)
I wonder if there is a practical way to calculate the mean by calculating the median and then weighting the components against the overall range so that the contribution of each value is biased against its distance from the median and whether that would provide a more useful result.

One issue is that the extremes are so extreme that plotting them distorts the graph to the point where most of the subtler patterns get obscured. Also, generally speaking with long tail distributions, medians are often, though not always, more useful than means for descriptive statistics precisely because it’s less sensitive to outliers.
 
One issue is that the extremes are so extreme that plotting them distorts the graph to the point where most of the subtler patterns get obscured. Also, generally speaking with long tail distributions, medians are often, though not always, more useful than means for descriptive statistics precisely because it’s less sensitive to outliers.
I can certainly repost these charts with no omissions if anyone wants, but you are correct the outliers are craaaaaazy.
 
One issue is that the extremes are so extreme that plotting them distorts the graph to the point where most of the subtler patterns get obscured.
Well, that is my point. If you can use the median along with the range of values to de-weight the outliers and en-weighten the more in-line values, you might get a realistic mean that is not distorted so much by the outliers.
 
Back
Top