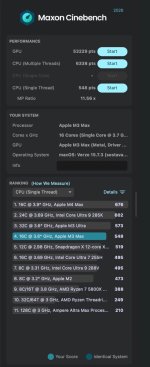
New version of Cinebench is out


Haven’t tested CB R26 yet myself, will be curious how all the CPUs and GPUs stack up versus R24. The SMT test could be interesting for SMT-enabled cores.
Seems to be worse than 24 in my very limited testing. Blender shows the M3 Ultra around a 5070 Ti, whereas the Ultra is significantly behind on CB26. Assuming this score is an 80 core version for the Ultra. My M4 Pro is behind a W6800 here also, whereas on Blender it’s ahead.
1767043247345.png

1767043299040.png


1767043597129.png
 
Seems to be worse than 24 in my very limited testing. Blender shows the M3 Ultra around a 5070 Ti, whereas the Ultra is significantly behind on CB26. Assuming this score is an 80 core version for the Ultra. My M4 Pro is behind a W6800 here also, whereas on Blender it’s ahead.
View attachment 37707
View attachment 37708

View attachment 37709
I remember the same being true for 2024 honestly. However, I have trouble digging up really good database of Mac results for R24 GPU benchmarks. So it's hard to compare exactly how things have changed.

Some more scores.


The CPU multicore scores look similar at first blush. For, the ST scores, the x86 might have caught up somewhat, but I suspect it is more that some of the results are from very overclocked processors - there are a huge range of different results for the same processor. So I suspect the CPU test hasn't changed much at least in terms of how processors are ranked even if the benchmark itself is different/harder.
 
M3 Max 16cCPU/40cGPU/48GB - power consumption in Cinebench 24 and 26 is about the same. (53W CPU and 30W GPU accordings to powermetrics) I have another scores from high power and low power.
Snímek obrazovky 2026-01-02 v 16.54.05.jpg


Snímek obrazovky 2026-01-02 v 16.54.33.jpg
 

Unfortunately some (but not all) of CPU Monkey's data is extremely suspect - the M3 Ultra data is clearly wrong for CB24 but seems reasonable for CB26 while the Intel 14000 series processors are all over the place in the new CB26 data so ... yeah. There does seem to be an improvement in older CPUs relative to newer CPUs and a slight improvement in Intel relative to Macs depending on the processor:


Unfortunately some (but not all) of CPU Monkey's data is extremely suspect - the M3 Ultra data is clearly wrong for CB24 but seems reasonable for CB26 while the Intel 14000 series processors are all over the place in the new CB26 data so ... yeah. There does seem to be an improvement in older CPUs relative to newer CPUs and a slight improvement in Intel relative to Macs depending on the processor:


Basically there seems to be a shift of about 6-8% in favor of x86 in CB26 and additional ~10% gain in favor of older CPUs. So if you use the correct CB 2024 data for the M3 Ultra (over 3000), that means the Ultra effectively retains its relative score relative to the 285K in the 2026 test compared to the 2024 test but the M4 Max slips a bit while an old Intel CPU like 9900K, while still being very behind, improves significantly between the two tests relative to the M4 Max (it goes from 2.7x behind in 2024 to just over 2.2x behind in 2026, a relative improvement of 20%). Meanwhile contemporaneous x86 processors like the 285 and 9900X3D seem to stay the same relative to each other across the tests. Fascinating.


For what it is worth the ST & MT ratio for the M4/M3 of GB 6's Ray tracer is 1.16 and 1.76 (huge variability in those measures though) and the Blender 4.5 CPU (tricky because they don't explicitly split the Macs by CPU core count for some odd reason in open-data, so you have to look at the distribution and pick the part of the histogram applying to your core count) for M4 Pro (14)/M3 Pro (11) is 1.8 (MT only) so both Blender and GB 6 RT subtest are very similar to CB 26's ratios rather than CB 24's.
 
Last edited:
Back
Top