The first two might be someone testing the 2-core turbo boost.I really struggle to understand some of these recent scores. They are all over the place.
View attachment 29132
You are using an out of date browser. It may not display this or other websites correctly.
You should upgrade or use an alternative browser.
You should upgrade or use an alternative browser.
Nuvia: don’t hold your breath
- Thread starter Cmaier
- Start date
Jimmyjames
Elite Member
- Joined
- Jul 13, 2022
- Posts
- 1,507
I assumed that would only affect the single-core scores. Wouldn’t the multi-core score prevent the 2-core turbo boost?The first two might be someone testing the 2-core turbo boost.
Last edited:
Probably can control it in the BIOS/EFI. These are machines meant for OEM testing as far as I know.I assumed that would only affect the single-core scores. Wouldn’t the multi-core score prevent the 2-core turbo boost?
Yeah whenever OEMs start testing, (presumably) accidentally published results get really wonky.Probably can control it in the BIOS/EFI. These are machines meant for OEM testing as far as I know.
Jimmyjames
Elite Member
- Joined
- Jul 13, 2022
- Posts
- 1,507
I thought I recall Qualcomm saying they would support dx12 and Vulcan. Their product briefing only mentions dx12 now.
It’ll have to for Linux …I thought I recall Qualcomm saying they would support dx12 and Vulcan. Their product briefing only mentions dx12 now.
Here is an earlier article that semiaccurate did about some Qualcomm design requirements stupidity. Again, no conformation that any of it is accurate:Absolutely
https://www.semiaccurate.com/2023/09/26/whats-going-on-with-qualcomms-oryon-soc/
Exclusive: Here's what Qualcomm didn't tell you about the Snapdragon X series
The upcoming Snapdragon X1 will be available in five different models: see their specs and performance here.
www.androidauthority.com
Attachments
Jimmyjames
Elite Member
- Joined
- Jul 13, 2022
- Posts
- 1,507
And yet reading the article you’d think it’s reasonable. Why are the “press" so tolerant of Qualcomm??Does not look good for Qualcomm. Their's power consumption numbers for M2 and M3 does not make sense though. Maybe they used power consumption for whole Mac with screen etc. even though they write CPU power? Or CPU+GPU+RAM for M2 and M3?Exclusive: Here's what Qualcomm didn't tell you about the Snapdragon X series
The upcoming Snapdragon X1 will be available in five different models: see their specs and performance here.www.androidauthority.com
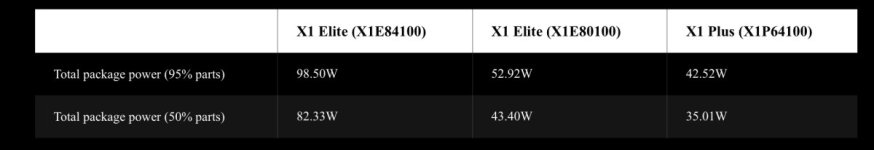
Yeah, triple power consumption of M3 Pro's CPU for similar performance. And I take figure for 50% X1 Elite. But variances among X1 chips is huge. Like 50% consumes 82W or less, but 95% consumes 98W or less. That is really bad.And yet reading the article you’d think it’s reasonable. Why are the “press" so tolerant of Qualcomm??
I'm having trouble getting power metrics to display the old format (cluster, CPU, DRAM, package). I guess it looks like this now?Does not look good for Qualcomm. Their's power consumption numbers for M2 and M3 does not make sense though. Maybe they used power consumption for whole Mac with screen etc. even though they write CPU power? Or CPU+GPU+RAM for M2 and M3?Exclusive: Here's what Qualcomm didn't tell you about the Snapdragon X series
The upcoming Snapdragon X1 will be available in five different models: see their specs and performance here.www.androidauthority.com
@leman did they change the format? I looked at the man page but couldn't figure out how to access the previous data, tried --unhide-info <samplers> comma separated list of samplers to unhide (backwards compatibility) with various "dram_power" or "package_power" to no avail. EDIT: it seems they have removed some of the old sensors?
But anyway assuming that CPU power is still the same, I could only get the M3 Max (14 core) up to 44W in Geekbench 6 polling every 100ns. Obviously this does not include everything.
Also the 50%/95% is just a weird metric ... as they say in the article that is usually binned so it's more consistent for the end user!
Also there really doesn't seem to be any evidence that it gets higher than 1220 in CB24 ... which ... how??? how is multicore fucked up this badly?
They follow the below analysis for power, but performance can't keep up somehow? The deep dives if anyone does one are going to be very odd. Cache problems? the fabric? (Qualcomm's reputation was it had the best fabric out of the Android SOCs, but maybe it doesn't scale? chipsandcheese thought their GPU fabric was a bit odd) Power system as @leman put forward? I mean how does it lose performance over 12 cores THAT BADLY! They might be on a slightly worse node than M2 (N4 might be slightly worse than N5P), but c'mon. Again, unless they're holding back data which would be very fucking weird ...
The only good thing is, yeah it's still better than the average Intel chip by a lot and often better to Zen 3/4, but it should be *even better*.
Yeah M2 Pro was the same as M2 Max (at 12 cores) and I think it was ~35W CPU and ~41W total package? Something like that? Obviously the M3 is just better than the Oryon ... but I think maybe given the node and the overall design the M2 is the better comparison in terms of where Qualcomm is. To me the Oryon is answering the question what would happen if you took 12 M2 P-cores with no E-cores and ramped the clock speed up? Obviously the fabric and SOC cache design is different too and Apple's may be better here. For the Oryon, I'm going with a CB24 score of 1500-1600 at 70W because I can't believe it's only 1220. But maybe it really is that bad ...
Let's say the top 8+4 M2 Pro (eq. to M2 Max) was 35/41W CPU/package - base clocks in Oryon are about 15% higher in their top model, no E-cores but 4 more P-cores. For simplicity assume the 4 Apple E-cores are roughly 1 Apple P-core in power and performance (it's better than that but never mind), let's do 3.8/3.3 Ghz * 12/9 cores * power = 54/63 W CPU/package. For CB24performance that would be 3.8/3.3 Ghz * 12/9 cores * 1059 = 1625. My estimate for power is a little low and my performance estimate seems a little high, probably because of my over simplification of the E-core contribution to power and performance. But overall it tracks. If the Oryon SOC's CB24 performance is actually 1220 "at 70W" on the other hand ... well then this shows that something got majorly fucked somewhere ...
Also good to point out that the name "All core turbo" for the clock speeds as reported in Anandtech imply those are not the clock speeds attainable under thermal constraints (i.e. the "23W" chassis). In addition to the different tiers of processors, it's unclear what their base clocks actually are. So a lot of the thin and lights aren't going to be hitting these clocks for very long.
It's also weird that in the article they split up the two clusters in "P-cores" and "E-cores" ... insert "they're the same picture" meme. I mean maybe these "efficiency cores" are the issue? Something we don't understand?
At least they did the Mac the honor of comparing the Oryon chip to the Pro processor? That's an improvement!And yet reading the article you’d think it’s reasonable. Why are the “press" so tolerant of Qualcomm??
Last edited:
- Joined
- Sep 26, 2021
- Posts
- 8,272
- Main Camera
- Sony
I'm having trouble getting power metrics to display the old format (cluster, CPU, DRAM, package). I guess it looks like this now?
View attachment 29165
@leman did they change the format? I looked at the man page but couldn't figure out how to access the previous data, tried --unhide-info <samplers> comma separated list of samplers to unhide (backwards compatibility) with various "dram_power" or "package_power" to no avail.
But anyway assuming that CPU power is still the same, I could only get the M3 Max (14 core) up to 44W in Geekbench 6 polling every 100ns. Obviously this does not include everything.
Also the 50%/95% is just a weird metric ... as they say in the article that is usually binned so it's more consistent!
Also there really doesn't seem to be any evidence that it gets higher than 1220 in CB24 ... which ... how??? how is multicore fucked up this badly?
They follow the below analysis for power, but performance can't keep up somehow? The deep dives if anyone does one are going to be very odd. Cache problems? the fabric? (Qualcomm's reputation was it had the best fabric out of the Android SOCs, but maybe it doesn't scale? chipsandcheese thought their GPU fabric was a bit odd) Power system as @leman put forward? I mean how does it lose performance over 12 cores THAT BADLY! They might be on a slightly worse node than M2 (N4 might be slightly worse than N5P), but c'mon. Again, unless they're holding back data which would be very fucking weird ...
The only good thing is, yeah it's still better than the average Intel chip by a lot and often better to Zen 3/4, but it should be *even better*.
It's also weird that in the article they split up the two clusters in "P-cores" and "E-cores" ... insert "they're the same picture" meme. I mean maybe these "efficiency cores" are the issue? Something we don't understand?
At least they did the Mac the honor of comparing the Oryon chip to the Pro processor? That's an improvement!
For the life of me, I don’t understand what they’re saying re: package power. That’s not how you normally communicate what i think is going on here (normally you’d use a Schmoo plot). Looks to me like they need to raise the voltage by around 5% in around half the parts to achieve the same clock frequency as the other 50% of the parts?
Yeah it's weird. My memory may be faulty but I seem to recall that you and @mr_roboto had a discussion awhile back how transistors could be designed for different power regimes and if you tried to pump too much power through "low power" transistors they wouldn't necessarily behave correctly. Could we be seeing that in action? Like Qualcomm is trying to pump too much power through a design which fundamentally cannot take it? Because as they say in the article:For the life of me, I don’t understand what they’re saying re: package power. That’s not how you normally communicate what i think is going on here (normally you’d use a Schmoo plot). Looks to me like they need to raise the voltage by around 5% in around half the parts to achieve the same clock frequency as the other 50% of the parts?
The huge jump between X1E-84-100 and X1E-80-100 might seem strange, given the difference between the two is just 400MHz on the CPU cores, but it is explainable. Semiconductor chips tend to require much more power to push them past a certain point on their operating points curves. 3.8GHz seems to be relatively high; Qualcomm is basically “overclocking” the chip out of the factory. Additionally, the higher-end chip requires different power delivery circuitry, which lets it consume way more power.
Normally voltage scales linearly with frequency right? Or have I got that screwed up? For the second best chip 1100 at 40W is actually fine! That's basically an M2 Pro's performance/W! Great! However, an 11% increase in clocks in the best chip would get the CB2024 score to 1220 from 1100 if performance scales linearly with clocks. But that 11% increase in clocks results in DOUBLE THE POWER USED. And its pushing the multicore clocks not the 2-core "TURBO" clocks higher ...
EDIT:
Recall that switching power consumption in a processor is proportional to the clock frequency and the square of the voltage. As the clock frequency is lowered, the power consumption is proportionally lowered. But as the voltage is lowered, the power drops much faster. Therefore, if it is possible to meet the performance requirements of the system at a reduced clock frequency and a reduced voltage, this will usually be preferred, as it will result in the lowest power consumption.
For example, consider a task which requires 1 ms to run on a 1 GHz processor at 1.4 V. Running the clock at one-half the frequency (0.5 GHz) will increase the time required to complete the task to 2 ms. Reducing the clock frequency to 0.5 GHz will reduce the power consumption by one-half, and the reduction of the voltage by about one-half, which will result in a 4 times further reduction in power. Therefore, if the performance requirements of the system can accept a 2 ms run time for this algorithm, by reducing the clock frequency and voltage it can consume one-eighth the power.
This doesn't seem like a complete explanation for what we're seeing, it's ~11% higher?
Like if the X1E80100 was the top chip I wouldn't have any problem with what I'm seeing. That's basically M2 Pro performance at M2 Pro wattage on a similar node to the M2 Pro (okay it should be better as we've discussed given the 12 vs 8+4 design, but still). X1E84100 is nuts.
Last edited:
Jimmyjames
Elite Member
- Joined
- Jul 13, 2022
- Posts
- 1,507
So I wonder if this is what the Semi Accurate article means by faking results. To achieve the scores promoted on their highest end chip, they need over ~100 watts in total, and from their briefing, the two reference designs for laptops are 23 watts and 80 watts tdp. So perhaps the oems are struggling to get close to these results because they designed their laptop to meet these tdp limits? That wouldn’t account for the claim that some of the scores were only 50% of the advertised ones, but that might be a result of poor software optimisation?
It’s also possible I’m misunderstanding the situation!
It’s also possible I’m misunderstanding the situation!
So I wonder if this is what the Semi Accurate article means by faking results. To achieve the scores promoted on their highest end chip, they need over ~100 watts in total, and from their briefing, the two reference designs for laptops are 23 watts and 80 watts tdp. So perhaps the oems are struggling to get close to these results because they designed their laptop to meet these tdp limits? That wouldn’t account for the claim that some of the scores were only 50% of the advertised ones, but that might be a result of poor software optimisation? It’s also possible I’m misunderstanding the situation!
Yeah Charlie seemed to be indicating bigger problems than that and Qualcomm is disclosing that info, sorta, and when confronted by the OEMs they originally stated “fix cooling” which didn’t work according to Charlie. Plus these laptop makers have to deal with Intel chips with way worse thermals and insane turbo modes. Truthfully if I had to guess the problems might be in poor software? Like not basic benchmarks but the software itself being poorly optimized - maybe especially non-native performance? I dunno. If it’s real at all, Charlie was being awfully vague in order to protect his sources. He said the problem was “above the level of the silicon” or something like that.

Also, if they stuck with the clocks on the 2nd highest tier chip, the thermals would look just fine. 1100 CB24 at 40W is basically the M2 Pro level performance you’d expect … if it’s real. And I got the impression from the article that the performance was bad not just at the highest end chip though again he was awfully vague.
But yeah the highest end chip … if I’m doing my math right based on the blurb I found, raising clocks by 11% should be ~37% increase in power consumption but it *doubles*.
 So maybe that is indeed part of it somehow. Like as I said trying to pump too much power and the normal power curve breaking down.
Also @Cmaier said the whole chip power consumption and percentage is just weird. For on thing it’s all one pool of chips that are binned so why would the variance within each bin be so large? That’s the whole point of binning!
Last edited:
- Joined
- Sep 26, 2021
- Posts
- 8,272
- Main Camera
- Sony
So I wonder if this is what the Semi Accurate article means by faking results. To achieve the scores promoted on their highest end chip, they need over ~100 watts in total, and from their briefing, the two reference designs for laptops are 23 watts and 80 watts tdp. So perhaps the oems are struggling to get close to these results because they designed their laptop to meet these tdp limits? That wouldn’t account for the claim that some of the scores were only 50% of the advertised ones, but that might be a result of poor software optimisation?
It’s also possible I’m misunderstanding the situation!
I’m beginning to think there are some shenanigans where, to achieve some of the benchmark numbers we’ve seen, they had to turn the voltage up beyond what the products are budgeted for. And it may be they are operating way to the right of the performance “knee.”
This generic curve sort of explains it. Every design has a different location on the plane, but the basic shape will be similar. If Qualcomm is operating out past the ”knee” of the curve, it might explain some of what we’re seeing. Ideally you want to be somewhere around the knee - as you move further to the right, the amount of power you have to add to get a given performance increase gets bigger and bigger, so you get more and more inefficient.
It seems even worse than that though right?I’m beginning to think there are some shenanigans where, to achieve some of the benchmark numbers we’ve seen, they had to turn the voltage up beyond what the products are budgeted for. And it may be they are operating way to the right of the performance “knee.”
This generic curve sort of explains it. Every design has a different location on the plane, but the basic shape will be similar. If Qualcomm is operating out past the ”knee” of the curve, it might explain some of what we’re seeing. Ideally you want to be somewhere around the knee - as you move further to the right, the amount of power you have to add to get a given performance increase gets bigger and bigger, so you get more and more inefficient.
View attachment 29167
Is it power = frequency X voltage^2? So an 11% increase in clocks results in 11% more power from frequency and 11% more voltage with the resulting expected power increase being 1.11^3 ~37%. Is that right? But the observed power increase is 100%.
Last edited:
KingOfPain
Site Champ
- Joined
- Nov 10, 2021
- Posts
- 806
Qualcomm claims that the Snapdargon X Plus can beat the M3 in multi-core performance. We'll see...
EDIT: I guess they mean that 10 performance cores can win against 4P+4E of the most basic M3.
 arstechnica.com
BTW, I'm not the greatest fan of the Mx naming scheme, but Snapdragon X is even worse. To have a Plus and Elite version, don't you need a more basic version first?
EDIT: I guess they mean that 10 performance cores can win against 4P+4E of the most basic M3.
Qualcomm says lower-end Snapdragon X Plus chips can still outrun Apple’s M3
Same NPU, same architecture as X Elite, but fewer cores and lower clock speeds.
BTW, I'm not the greatest fan of the Mx naming scheme, but Snapdragon X is even worse. To have a Plus and Elite version, don't you need a more basic version first?
Last edited:
It had better with 10 performance cores.Qualcomm claims that the Snapdargon X Plus can beat the M3 in multi-core performance. We'll see...
Qualcomm says lower-end Snapdragon X Plus chips can still outrun Apple’s M3
Same NPU, same architecture as X Elite, but fewer cores and lower clock speeds.
BTW, I'm not the greatest fan of the Mx naming scheme, but Snapdragon X is even worse. It have a Plus and Elite version, don't you need a more basic version first?
Edit: I see your edit @KingOfPain, yup that’s exactly what they mean so not much of an accomplishment. The end user may not care (unless the cost goes up) but that means they had to spend a lot more silicon for the same result (“winning” by 10%) so either costs go up or profits go down.
Last edited:
- Joined
- Sep 26, 2021
- Posts
- 8,272
- Main Camera
- Sony
Power is proportional to frequency x voltage^2, yes. (There’s a C and a ½ in there, too). But not sure I understand the rest of your post. Voltage and frequency are, in a sense, independent. You can, in theory, increase frequency without increasing voltage, and vice versa. (Though, to achieve more than a little frequency gain you likely need to increase voltage, because higher voltage causes transistors to switch faster).It seems even worse than that though right?
Is it power = frequency X voltage^2? So an 11% increase in clocks results in 11% more power from frequency and 11% more voltage with the resulting expected power increase being 1.11^3 ~37%. But the observed power increase is 100%.
That relation describes independently switching circuits. When amalgamated into a large chip, we usually see the kind of curve I drew above. As the curve gets more and more horizontal (there’s a horizontal asymptote), a small increase in performance can require a huge increase in power.